The Monetary Base
Expansion of the Monetary Base in the United States and Other Countries
- The expansion of the monetary base by the Fed and other central banks can be potentially inflationary.
- The historical relationship between the monetary base and the total money and quasi money in a given economy is governed by the money multiplier. Given that the US monetary base has exploded in the past year, we’d quickly experience hyperinflation if the money multiplier reverted to its historical average.
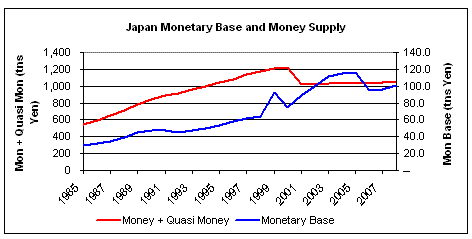
- I’m just not yet convinced it will. In Japan, the central bank doubled the monetary base from 2001 to 2003, but overall bank assets and deposits hardly budged, leaving overall money supply growth at low levels. Inflation never materialized, and the Bank of Japan reduced the monetary base back to sustainable levels in 2006.
- The recent Fed initiative to pay interest on reserves may also lower the multiplier long-term.
- Given that the United States in 2009 seems hardly better off than Japan in 2001, I’m not yet convinced that the expansion in our monetary base is going to necessarily lead to a substantially increased overall money stock. It is certainly plausible. But I don’t think that high inflation due to our expanded monetary base is a foregone conclusion. If you think otherwise, I would love to hear why it will happen here when it didn’t happen in Japan. Or Sweden, for that matter, during the 1990s.
In the past several posts, I’ve written about the U.S. current account deficit and burgeoning global government debt, and how they spell potential long-term doom for the dollar. Now we’re going to discuss the unprecedented expansion of the monetary base, both in the United States and in other countries.
I’ll begin with some crude economics. An oft-quoted equation in economics is MV=PY, where M is the money supply, V is the velocity of money (how frequently it changes hands), P is the price level and Y is output. Assuming we keep V and Y the same, an increase in the money supply M will translate to an increase in the price level P. Put qualitatively, if we have an economy with 10 goods and 100 dollar bills, and then introduce another 100 new bills, prices should double as long as consumers are transacting with the same frequency. A product previously worth $20 should now be worth $40 because there is more money chasing the same number of goods. This email is about what is currently happening to the money supply M as a result of the Fed’s quantitative easing policies.
What exactly is the money supply? The most broad definition in the US, M3, is the sum of currency in circulation, bank deposits, money-market funds, short-term repurchase agreements and similar large liquid assets. The Fed stopped tracking M3 several years ago, and its most broad definition of money is now M2, which only includes currency, bank deposits, time deposits under $100k, and money market deposit accounts for individuals. The IMF however tracks “Broad Money” and “Money + Quasi-Money”, which are more comparable to M3, and we’ll use the IMF’s Money + Quasi-Money statistics in some of our discussions.
Money creation begins at the central bank. There are a variety of ways the central bank can increase or decrease the money supply. It can print physical greenbacks and release them to the public. It can purchase securities from the private market or government using newly printed currency. It can dump new money onto banks’ balance sheets. All of these methods of increasing the money supply involve an expansion of the central bank’s balance sheet. I have attached the Fed’s balance sheet on page 1, showing years 2003 to 2008, as well as the five most recent quarters. In 2003, 87% of the Fed’s liabilities were currency outside banks, which was simple currency the Fed had released to the public. Another 6% of the 2003 liabilities were vault cash at commercial banks. 3% were reserves held at Central Banks. The total sum of the Fed’s liabilities were $788bn. On the assets side, 84% of the Fed’s assets were treasuries. For the most part, the Fed had released money into the system by purchasing treasuries.
In Q109, the picture was different. The Fed’s total liabilities were $2.1 trillion, up from the $788bn in 2003. Only 40% of liabilities were currency outside banks, with an additional 2% being vault cash at commercial banks. Now, depository institution reserves, or reserves of commercial banks held at the Fed, had ballooned to 38%. As well, funds deposited by the Treasury at the Fed were now 13%.
We’ll return to the expansion of the Fed’s balance sheet later, but first we want to discuss the link between the Fed’s liabilities and the overall money supply. As previously discussed, the Fed can increase the money supply in a variety of ways, and can do so by increasing its liabilities. A couple of the largest items, the currency in circulation, the currency in bank vaults, and the reserves commercial banks hold in their accounts with the central bank, are aggregated into the monetary base, or M0.
In 2003, the monetary base stood at $747bn. M2 however was $6,082 billon, using IMF numbers. M3 was 8,928bn, while Money + Quasi-Money was $8,668bn. The ratio between the monetary base and more broad definitions of money such as M2, M3 and Money + Quasi-Money is called the money multiplier. A crude money multiplier formula is MB = M/R, whereby MB is the monetary base, M is the money supply (ie. M3 or Money+Quasi Money) and R is the ratio of bank deposits to required reserves. The idea behind the money multiplier is this: when the Fed adds $100 to the system, let’s say it gives it to a bank. The bank takes that $100, keeps $10 as reserves, and lends $90 out to Max. Max takes the $90 and uses it to buy a $90 air-conditioner. The air-conditioner seller now has $90, and deposits it in the bank. The bank keeps $9 of that, and lends out $81 to George. George takes $81 and buys a new table. The table-seller deposits the $81 into the bank. The bank keeps $8 as reserves, and lends out $73 to Bill. Bill uses his $73 to buy a plant. The plant-seller deposits his $73 into the bank. The bank keeps $7 as reserves, and lends out $66 to Harry. Harry buys a phone, the phone-seller deposits the funds into the bank, and so on. As we can see, a hundred dollars created by the Fed actually results in much more than $100 of money being created, because banks only keep a fraction of their loans as reserves. The money multiplier, which can crudely be thought of the ratio of bank deposits to required reserves, tries to capture just how much money is created by an additional dollar of reserves, which can be thought of as newly released “high-powered” money printed by the Fed. Put another way, the money multiplier tries to determine how much M3, or broad money, is created for each dollar of M0, or monetary base.
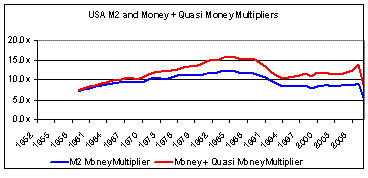
Below is a chart of the US M2 money multiplier and Money + Quasi Money Multipliers historically. These are simply M2 / Monetary Base and (Money + Quasi Money) / Monetary Base. Note the sharp correction downward in 2008.
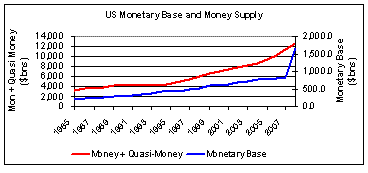
What caused the contraction in money multipliers? Banks have not been lending out their newfound reserves, so even though the monetary base has gone up, the total money supply has stayed flat, resulting in a lower money multiplier. Another reason may be that in October 2008, the Fed began to pay interest on reserves – as a result, banks may be more willing to keep their liquid assets as reserves, as opposed to treasuries, which are not counted as part of the monetary base. Below is a graph demonstrating the increase in the monetary base relative to Money + Quasi Money.
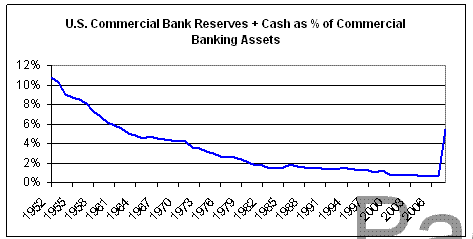
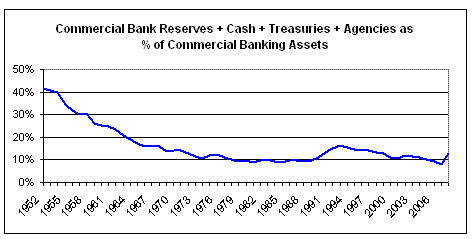
Let’s look at the reserves at commercial banks relative to their total assets.
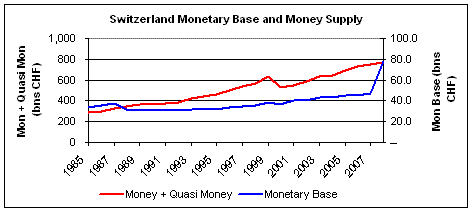
This is occurring all over the world, from Sweden to Switzerland.
Here’s Sweden:
And Switzerland:
With the larger reserves, if US commercial banks were to lend such that their bank reserves and cash returned to the same percentage of total commercial bank assets in, for instance, 2000, the overall money supply would surge.
I’ve also looked at the historical ratio of commercial banking assets to reserves, cash and treasuries. Before October 2008, the Federal Reserve was not paying interest on reserves, and therefore banks didn’t opt to hold their cash as reserves unless required to. So, assuming they held that cash as treasuries, let’s take a look at the ratio of commercial bank assets to reserves, cash, treasuries and agencies.
By this metric, commercial banks’ likelihood to increase their assets materially would appear lower – their total assets as a multiple of their liquid assets (cash, reserves, treasuries and agencies) hasn’t risen that much with the expansion of the monetary base.
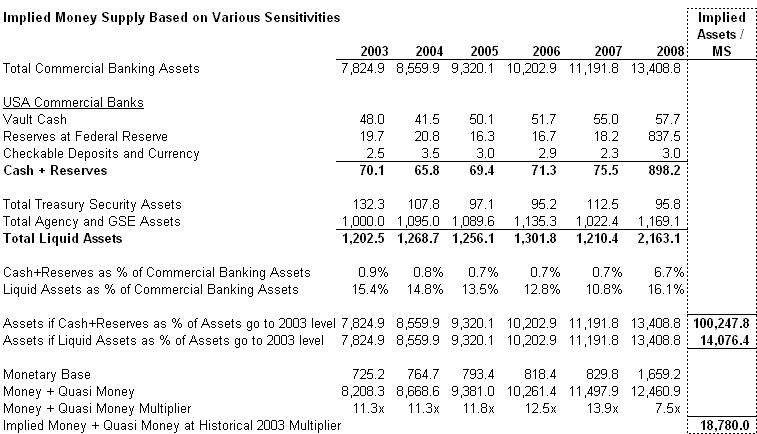
Finally, here’s some math designed to quantify how much the money supply could grow as a result of the increase in the monetary base. I’ve looked at the implied money supply if (a) the money + quasi-money multiplier returns to 2003 levels, (b) commercial banking assets as % of cash + reserves returns to 2003 levels and (c) commercial banking assets as % of cash + reserves + treasuries + agencies return to 2003 levels.
The results are interesting. If total banking assets reaches historical levels of assets to reserves (for instance, the 2003 level), the money supply explodes by a factor of 10. If however, banking assets expand to reach historical multiples of their liquid assets, total assets would not increase by much at all. Looking at the money multiplier, if the money supply to monetary base ratio returns to 2003 levels, the current level of monetary base would imply a Money + Quasi Money number that is one and a half times higher than today.
So there are some numbers.
I haven’t yet discussed how the monetary base grew in 2008, so I’ll touch on that now briefly. As mentioned previously, historically, the Fed expanded the monetary base mainly by purchasing treasuries (its newly acquired assets) with new currency (which would become its liabilities). In the 2nd half of last year, as can be seen by looking at Q108 to Q109 on page 1, the Fed began to use unconventional “quantitative easing” policy tools to inject liquidity into the banking economy. In some cases, like with the bailouts of AIG or Bear Stearns, it purchased illiquid assets (ie. AIG or the Maiden Lane assets). In other instances, like the AMLF or Commercial Paper Funding Facility, the Fed injected liquidity by accepting commercial paper as collateral. To some degree, the new liquidity was in the form of increased currency outside of banks. But to a far larger degree, the new liquidity found its way to banks’ balance sheets, resulting in the ballooning of “Depository Institution Reserves”, or reserves of banks. The giant expansion of reserves is what inflation bulls are most concerned about. As we laid out above, theoretically, large reserves can be very inflationary, because of the money multiplier effect. And the increase in reserves in 2008 is unprecedented.
So the question is: when and how quickly will those reserves multiply into an exponential increase in the money supply, and to what degree are they being offset by reduced money supply as a result of contracting credit.
It’s difficult to tell. The aggregate assets and liabilities of commercial banks are on page 2 of the materials. Bank assets have declined slightly over the past year, dropping by about 2% since November 2008, judging from the H.8 release of the Fed, which monitors Assets and Liabilities of Commercial Banks. For what it’s worth, bank assets are still higher than they were at this time last year. The other broad trend that we see from the H.8 release is the large jump in cash and reserves on the assets side, and the similar large increase in deposits. That appears to be mainly the result of the direct increase in monetary base.
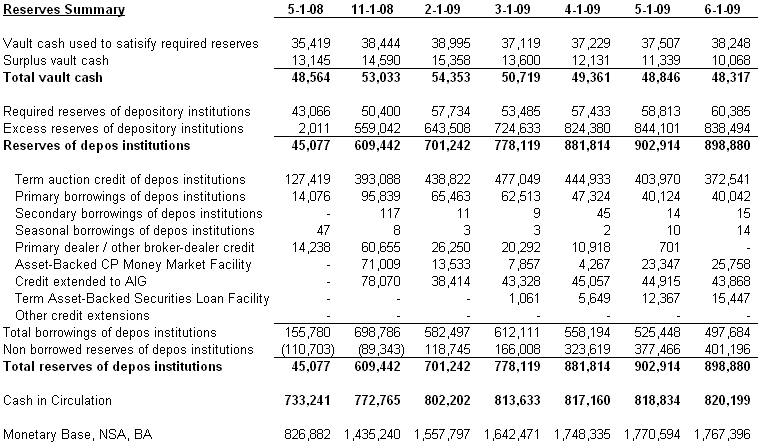
To get a bit more granular with regard to the commercial bank reserves, let’s split out “borrowed” reserves vs. “non-borrowed” reserves. The Fed provides data breaking down commercial bank reserves into reserves that have been directly borrowed from the Fed as part of a recent liquidity facility, and reserves that are not directly linked to a Fed loan. The data is on page 3 and 4 of the materials. I have also pasted the data below.
Again, we should note that in October 2008, the Fed began to pay interest on reserves that commercial banks kept at the Fed. That’s partly why non-borrowed reserves swings from dramatically negative in September / October to positive thereafter.
In the chart above, we can see borrowed vs non-borrowed reserves. The bulk of borrowed reserves are part of the Term Auction Facility, or TAF, which was begun in 1H 2009 as a way to provide liquidity to commercial banks and other financial institutions. TAF funds have short maturities, as can be seen below:
With TAF funds comprising 73% of borrowed reserves, banks may not be eagerly lending out TAF funds, since the loans will come due within 90 days. It’s unclear what the maturity schedules of the other borrowed reserves are. But even if we assume that the other borrowed reserves’ maturities are short-term, banks still have $401mm of non-borrowed reserves. I assume that these non-borrowed reserves are not saddled with any restrictions that prevents banks from lending them out. I also assume that banks are parking those funds with the Fed simply to benefit from the higher interest rates. When will they begin lending those funds out, and therefore increasing the money supply via the multiplier effect? I don’t know.
When banks begin lending out these funds and the money supply begins expanding, the Fed can try a variety of things to drain liquidity and remove reserves from commercial banks’ balance sheets. For the TAF and other borrowed reserves, it can simply wait for the maturities to expire and not roll over the debt into new funds. It can raise interest rates. It can have the Treasury sell more short-term government notes to drain liquidity via its newly created Temporary Supplementary Financing Account. It can resell some of the assets it has bought during the current crisis. There are a variety of ways that the Fed can reduce reserves, drain liquidity and shrink its balance sheet, in the event that the money supply and inflation begins to surge, or show signs of surging. Note that I’m not particularly concerned with the Fed suffering high capital losses on its securities, and therefore needing to be recapitalized, an event which itself could be inflationary. Peter Stella published an intelligent paper this month titled “The Federal Reserve System Balance Sheet – What Happened and Why It Matters”, which analyzes potential losses that may result from the Fed’s exotic security purchases. I came away not feeling particularly concerned about those losses, and Stella writes in his abstract: “Although risks are considerable in certain unlikely scenarios, FRB capital, earnings capacity, and reserves are more than ample to preserve their financial independence”.
A more common criticism, however, is that the Fed is going to be too slow to drain the current excess reserves once the recovery begins and commercial banks resume lending at the same assets-to-reserves ratios they were in prior years. The issue is not so much a lack of policy tools, but a lack of will. The 1970s were a case study in the Fed being too timid to rein in the money supply in the face of political pressures to stimulate the economy. Inflation bulls think that the current Fed will similarly be undisciplined.
To them, Paul Krugman says this:
“Now, it’s true that the Fed has taken unprecedented actions lately. More specifically, it has been buying lots of debt both from the government and from the private sector, and paying for these purchases by crediting banks with extra reserves. And in ordinary times, this would be highly inflationary: banks, flush with reserves, would increase loans, which would drive up demand, which would push up prices.
But these aren’t ordinary times. Banks aren’t lending out their extra reserves. They’re just sitting on them — in effect, they’re sending the money right back to the Fed. So the Fed isn’t really printing money after all.
Still, don’t such actions have to be inflationary sooner or later? No. The Bank of Japan, faced with economic difficulties not too different from those we face today, purchased debt on a huge scale between 1997 and 2003. What happened to consumer prices? They fell.”
Paul Krugman, The Big Inflation Scare, http://www.nytimes.com/2009/05/29/opinion/29krugman.html
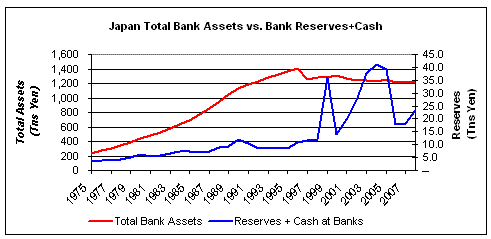
OK, so let’s look at Japan. Beginning in 2001 and lasting until 2006, Japan embarked on a quantitative easing policy, which involved increasing bank reserves and the monetary base, as can be seen below.
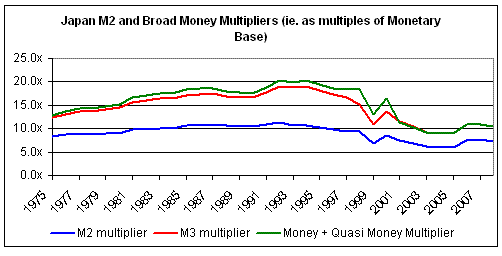
The multiplier similarly declined in Japan.
And inflation never materialized. The increased reserves never resulted in a material increase in total commercial bank assets. Instead, commercial bank assets continued to decline. The money multiplier dropped in 2001, and remained relatively low until 2006, when quantitative easing ended. At that point, the multiplier expanded a bit, but only because reserves were reduced, not because banks’ assets began surging.
I will concede that the Fed’s current actions are more aggressive than Japan’s were. America’s monetary base has doubled in the past year, while Japan’s increased by 1.5x. Commercial bank reserves have gone up nearly 40x in the US. In Japan, they went up 3x.
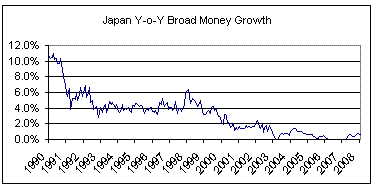
Let’s also look at the money supply growth of Japan, specifically of broad money growth since 1990. As we can see, Japanese broad money growth plummeted below 6% shortly after its credit bubble burst in 1990, and has rarely risen above 5% since. The Japanese central bank has been much more conservative than the American one.
Compare that to the US money supply. Looking at M2 + Money Market Funds (a narrower definition of broad money that may be understating real money + quasi money growth), we’ve been flirting with 10%+ growth since September 2007. We’re hovering near our highest money supply growth levels in the past 40 years.
That said, I’m still fixated on the fact that Japan suffered minimal inflationary pressures when it expanded its monetary base. Some blame the liquidity trap – at zero interest rates, money and short-term government bonds are close substitutes, so banks merely substitute bonds with cash, as opposed to lending the new reserves out in such a fashion that would allow the money multiplier to increase the money supply. Banking assets may have also remained stagnant due to significant excess capacity, which resulted in borrowers who didn’t want to borrow and lenders that didn’t want to lend. Or maybe insolvent banks hoarded cash rather than lending it out. There is also the output gap, which measures the difference between actual and potential GDP, and exerts downward pressure on prices due to low capacity utilization in the economy. I’m not sure the specific manner in which the output gap keeps the money multiplier low, but it may be related.
Looking at the United States, I’m not sure how the US is better off today than Japan was in 2001. Our interest rates are near zero. Our banks are insolvent. Our capacity utilization is low. If banks didn’t boost lending when they were given new reserves in Japan, why will they do so in the US, anytime soon?
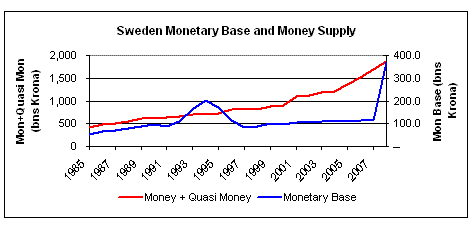
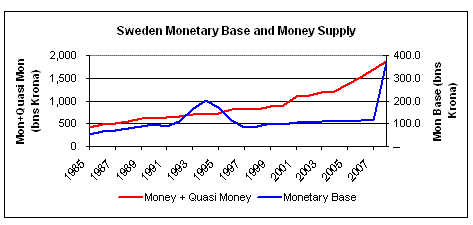
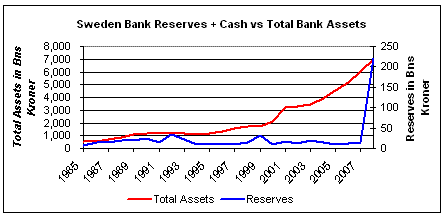
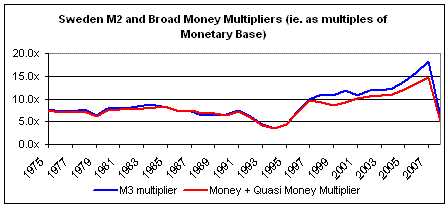
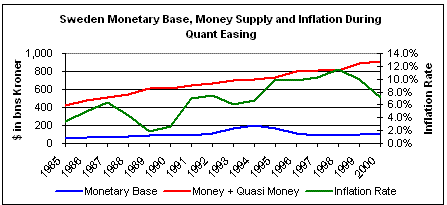
As a final point, I also looked at Sweden in the mid 1990s. Sweden was hit by a vicious banking crisis in the early 90s, and conducted its own bank bailout. The Swedish government’s solution seemed somewhat different than what we’re trying to do in the US, since Sweden seemed to divide its problem banks into good banks and bad banks, as opposed to fortifying the banks with new reserves. But, as in Japan, Sweden expanded its monetary base in the mid 1990s. The relevant charts are on page 9 of the attached materials, and pasted below.
In the mid 1990s, the monetary base and total commercial banks’ reserves increased as the government bailed out the nation’s insolvent banks. The money multipliers sank.
But inflation never ended up occuring, and when the banking system recovered, the monetary base was reduced, and the money multiplier rose back to its historical levels.
As a sidenote, It’s quite evident that the monetary base expansion in the mid 90s is much smaller than Sweden’s expansion today.
I can see the argument about how the expansion of U.S. monetary base can be inflationary. The theory is sound and the forecast is plausible. But if banks don’t lend out the reserves and allow the money multiplier to do its work, the increased monetary base will not necessarily lead to an exponentially higher money stock. That’s not to say that inflation will not occur. As I’ve written before, I think the US current account deficit is unsustainable, and at some point, that game must end. It may be in the near-term or it may be in the long-term. I’m also convinced that global government debt in advanced economies will one day become so unmanageable that governments will inflate away their debts. That is a long-term problem, and may not manifest itself for 5+ years, or longer. But will we suffer inflation due to the expansion of the monetary base? It’s possible. But I could not find enough evidence to say that it’s “probable”.
I will finish by mentioning that if it occurs, the potential for hyperinflation exists, since the expansion of the monetary base represents a tremendous amount of dry powder.
So at the very least, it’s probably a good idea to monitor the Fed data regularly.
LEGAL:
THIS COMMUNICATION IS FOR INFORMATIONAL AND EDUCATIONAL PURPOSES ONLY AND SHALL NOT BE CONSTRUED TO CONSTITUTE INVESTMENT ADVICE. NOTHING CONTAINED HEREIN SHALL CONSTITUTE A SOLICITATION, RECOMMENDATION OR ENDORSEMENT TO BUY OR SELL ANY SECURITY OR OTHER FINANCIAL INSTRUMENT OR TO BUY ANY INTERESTS IN ANY INVESTMENT FUNDS OR OTHER ACCOUNTS. THE AUTHOR HAS NO OBLIGATION TO UPDATE THE INFORMATION CONTAINED HEREIN AND MAY MAKE INVESTMENT DECISIONS THAT ARE INCONSISTENT WITH THE VIEWS EXPRESSED IN THIS COMMUNICATION. THE AUTHOR MAKES NO REPRESENTATIONS OR WARRANTIES AS TO THE ACCURACY, COMPLETENESS OR TIMELINESS OF THE INFORMATION, TEXT, GRAPHICS OR OTHER ITEMS CONTAINED IN THIS COMMUNICATION. KERRISDALE CAPITAL MANAGEMENT, LLC OR AFFILIATED ENTITIES MAY OWN SECURITIES OF OR OTHERWISE HAVE AN INVESTMENT RELATED TO ANY COMPANIES MENTIONED IN THIS COMMUNICATION. THE SENDER EXPRESSLY DISCLAIMS ALL LIABILITY FOR ERRORS OR OMISSIONS IN, OR THE MISUSE OR MISINTERPRETATION OF, ANY INFORMATION CONTAINED IN THIS COMMUNICATION.




Add New Comment