


Imagine you’re choosing between investing in two start-up businesses. Both will start with $10mm and invest in projects expected to generate a 15% return. The only difference between these two companies is that one will invest in tangible factories and the other will invest in intangible R&D. So far, you would be correct if you said these companies should be valued equivalently. But would you be able to tell that these companies are equivalent by looking at their financial statements? Let’s look at the first 5 years of two startups, starting with the factory builder:

This is as basic as a company gets. It started with $10mm, had the factory built at the end of the first year, and started generating revenue by 2002. We’ll assume 30% Gross margins, 15% RoIC, and a 10% depreciation rate. All cash at the end of the year is reinvested in the factory, allowing it to grow revenue by 15%/year.
Now let’s look at a company with equally attractive investment opportunities, but in R&D:

This company is identical; same revenue, same gross margins, same SG&A expenses. But it doesn’t look like they’re profitable, consistently running a break-even business. If the Factory Builder could be bought for $22.8mm, you might say that’s a fair price at 10x earnings. But would you pay that much for the Inventor? If the Inventor was being sold for $10mm, how could we as investors compare these two companies?
For any value investor looking at companies in the tech space, it’s important to understand how to capitalize R&D. What we’re saying when we expense R&D is that our investment only benefits the current period. Obviously in the case of the Inventor above, that’s not true. If they have no assets, what are they using to generate and grow $100mm of revenue? Past R&D is a valuable asset. What we need to do is capitalize (as opposed to expense) the R&D, meaning we take it off the income statement and move it to the cash flow statement. We then create a balance sheet item to represent the asset value of our accumulated R&D, and an income statement line-item to reflect the R&D amortization identical to PP&E depreciation. Here’s our modified Inventor financial statements:
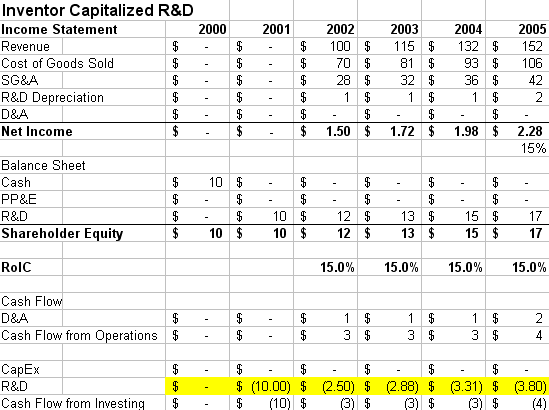
Now these two companies appear to be identical, as they should. They have the same net income, same shareholders’ equity, and even the same cash flow statements. Effectively all we’re saying when we make these adjustments is that R&D will benefit future periods. Obviously the underlying company hasn’t changed. All that’s changed is our ability to compare these companies side-by-side.
To make this presentation understandable, we’ve made some simplifications. For example we’ve ignored taxes, for simplification purposes. We also are dealing with two very basic companies. But most importantly, we assume that we know the correct amortization rate for our intangibles. In practice, we would have to guess what this is, but we can check our assumptions with a little trick.
If a company is continually reinvesting earnings in similar projects, the return on invested capital should stay somewhat steady over time, as we saw in the examples above. If we accidentally assume that the depreciation rate is too high or too low, the RoIC will appear to increase or decrease. For example, consider the table below where we estimate an amortization rate that is too high:

In 2002, the increase in R&D Depreciation from $1.00 to $1.50 decreases the Net Income by $0.50. When we compare our $1.00 return to the previous year’s Shareholder Equity of $10, it appears as though our RoIC is reduced from 15% (in the normal case) to 10%. However, as our model progresses, the RoIC will naturally rise. Conversely, if we choose an amortization rate that is too low, net income and RoIC will appear high but slowly deflate, as in the example below:

We can see from these three examples how sensitive the model is to choosing the correct depreciation rate. If we were to value these companies by simply multiplying earnings by something like 10x, we would get vastly different valuations. But it’s not just the model that’s sensitive, real companies with real financial statements are making assumptions that affect our ability to value them. The trick is to find a reasonable depreciation/amortization rate which results in a steady RoIC. By homing in on a stable RoIC, we get a better sense of what the company needs to invest to continue growing, and that puts us in a better position to value the business.
This technique is not always easy to use, especially for companies with noisy data and changing investment patterns. It’s not the first tool in our toolbox. But when we’re looking at a tech company that intuitively appears to be trading at a low valuation, this technique can help us get more comfortable with the numbers. It also allows us to compare the long-term performance of companies with short product life-cycles that will be selling different products to different customers in only a few short years. For a long-term investor in tech, having a sense for what average rate of return a company has historically generated on R&D allows us to ignore short-term sales volatility to see the big picture.

Add New Comment